Last year, I attended the best CPD of my teaching career. It was a year-long course run by the NCETM; a project on multiplicative reasoning. Now don't get me wrong, training days can be useful, but I can honestly say that this course changed how I teach fractions and proportion on a fundamental level. We had six days of training, spread out over the year, and had to deliver certain materials to our KS3 classes, then evaluate their performance at the end of the year to assess the effects of the project materials. I'm going to blog more about this in later posts, but in this post I wanted to focus on one of the first questions they asked us on Day 1, because it really altered my thinking about teaching fractions. It's a simple question:
Just to give a bit of context to this, this was one of four diagnostic questions we had to give our classes prior to delivering the project materials. The students had to answer the questions in as much detail as they could, and explain their reasoning.
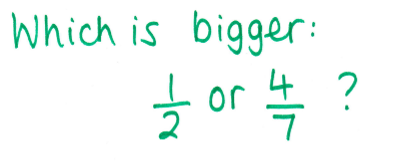
We also had to try the questions. I suggest you give it a go now, too! Go on, before you peek at mine...
We also had to try the questions. I suggest you give it a go now, too! Go on, before you peek at mine...
1. Is it really obvious that equivalent fractions are needed?
My solution looked like this:
My solution looked like this:
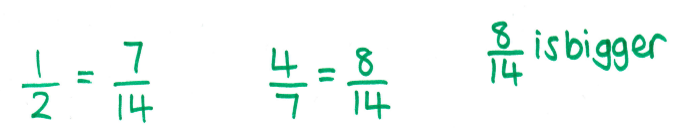
I then put my pen down smugly, with the satisfaction that I'd got the right answer and this question was easy. Then I looked up and everyone was still scribbling.
I realised I was looking at it from the point of view of a maths graduate and teacher; I'm comparatively "good at maths", whatever that means. When I thought back about what I'd done, I'd automatically jumped to writing both fractions as fourteenths, because I'd "seen" the denominators 2 and 7. I knew I needed to use equivalent fractions, and that 1/2 is the same as 7/14.
But how many of my students really understand that? Given that I've had GCSE students ask me what an equivalent fraction is, possibly fewer than I assume. My "explanation" relies on a deep understanding of fractions, and presupposes a lot of things. When I tried this with my KS3 classes both last year and this year, the only students who immediately jumped to equivalent fractions, like I did, were those considered "high ability"; i.e. students in higher maths sets.
I went back to my paper, and decided to think how I would explain this when teaching it, or how a student who didn't think to use equivalent fractions might approach it.
2. Fractions are all about pizza, right?
I decided to draw a picture; this is what I'd probably do to convince a student who didn't understand my equivalent fractions explanation:
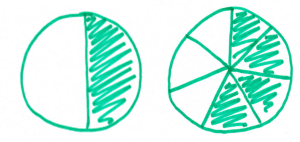
Pretty convincing? You can see from my diagram that 4/7 is slightly bigger than 1/2.
However, what you're looking at there is attempt #5 at drawing sevenths on a circle. If you tried this problem, chances are, you drew a pizza too. And it probably took you several goes to get the sevenths looking right.
I think there were about 20 or so maths teachers there, and nearly all of us drew pizzas. When I took this away and did it with my KS3 classes, and then when I tried it again with them all this year, nearly all of them drew pizzas too. And, unsurprisingly, all of them found it at least as difficult as me to draw sevenths accurately. I've actually seen students draw things that cause conceptual misunderstandings, like this one:
When I do this task with a class now, I ask students to come to the board and draw their diagrams. They always find it difficult to draw the second one correctly, even if they've got it fairly accurate in their book.
Pizzas are pervasive in teaching fractions. I guess I can see why; most students will have seen pizzas cut up into pieces, but think about the size of those pieces. Order a takeaway pizza and it's usually sliced into eighths, with options for sixths or tenths occasionally, but never something difficult to cut, like ninths or sevenths. When I cook a pizza, I half, half and half again because that's the easiest way to get equal slices. I tried cutting a pizza into sevenths once, just for kicks. Unsurprisingly, I got something that looked like the picture above (and a very messy tea).
Maybe the pizza model is useful, but it's not the only thing we cut up and share out. I realised that I always supplied students with the example of pizza (or occasionally, a birthday cake), but never thought about using non-circular pictures, like a chocolate bar.
3. Why not use a rectangular model?
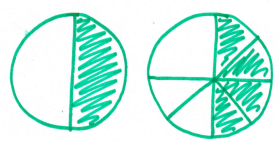
After a bit of discussion along the lines above, we were asked to have a go at drawing a rectangular diagram:
First of all, I found this much easier to do. Splitting into sevenths still isn't really straightforward, but this was attempt #2, rather than #5. I don't know if it's something about the linear representation, but I could just tell that these pieces were more equally drawn than on my circles. I've seen students draw seven pieces, one by one, then draw the other diagram the same size and split in half by eye (much easier to do).
Secondly, there's a direct comparison - you really can see that 4/7 is bigger than 1/2, and even begin to see by how much. It's not a full seventh bigger, it looks more like half a seventh (and believe me, if you try this with a group of students and they go down that route, the discussion that comes out of that is invaluable).
This idea of rectangular modelling comes from Singapore. Over the last 18 months or so, I've seen and heard the words "Singapore bar model" more and more frequently in blogs and lesson plans. It seems to be the latest "trendy" idea in maths teaching, but don't dismiss it just because of that - it's actually really useful in loads of areas of maths.
4. Taking it further
We did all of our work for this first part on plain paper, and it's worth getting students to do this too initially, just to see what they can manage to do by estimating. However, when I've used this task as a precursor to a unit of work on fractions this year, we've done this, then moved to their books, which have squared paper in them - and this is where the bar model really gets interesting.
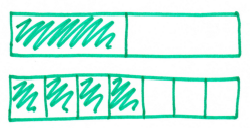
I ask students to draw the diagrams in their books, and think carefully about how they can use the squares to help them. Inevitably I get a couple of these:
I ask students to draw the diagrams in their books, and think carefully about how they can use the squares to help them. Inevitably I get a couple of these:
This leads to a great discussion about what the whole amount is. Coming back to a chocolate bar analogy here is useful; are the two bars drawn there the same size? Once that discussion has happened, then most go to this:
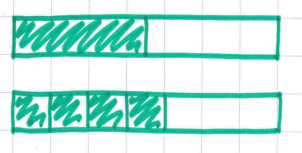
We then talk about how they have chosen the length of their bar, and why there are 3 and 1/2 squares shaded on the top diagram. Some students then refine their earlier explanations about why 4/7 must be bigger, along the lines of "with 1/2 you only get 3 and 1/2 pieces but with 4/7 you get 4 pieces". It's also a nice opportunity to discuss whether it's OK to have decimals as numerators of fractions.
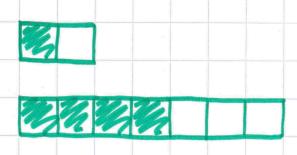
Depending on the class, it then goes one of two ways. I sometimes find that one or more students has naturally drawn something like this:
Depending on the class, it then goes one of two ways. I sometimes find that one or more students has naturally drawn something like this:
This leads to a really interesting discussion about why the length 14 has been chosen, and links really nicely into equivalent fractions.
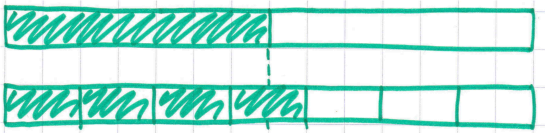
If no-one has done this, then I challenge students to redraw their original diagrams using a different length of bar, but that they must avoid having half-squares on their new diagrams, ultimately leading to the same result - lots of bars of length 14, with a discussion about why. I occasionally get a bar of length 28, which makes the discussion even more interesting.
I don't tend to push towards equivalent fractions straight away. Some may spot that 1/2 is the same as 7 pieces out of 14, but I give them a bit more practice with some other examples first.
You can download some example questions here, or have a go at making your own up - I promise it's a lesson worth trying!
 RSS Feed

Let me add one point - the bar model connects very readily to a number line model, and consequently to the idea that fractions are numbers, which is a critical idea for students to understand. How we represent and extend students' understanding of fractions is going to help build toward that idea.