Miss Norledge's Storeroom
  • Home
  • Resources by Topic
    • Number and Proportion
    • Algebra
    • Shape
  • Blog
    • Summer Blog Challenge
    • Staffrm 29 Days of Writing (2016)
    • Maths with Zoombinis
  • My resources
    • Downloads >
      • Mix Match
      • Rally Coach
      • Pass the Problem
    • Request a password
  • Links
    • Teaching blogs and resources
    • Web tools and apps
    • Exams and assessment
  • Privacy Policy


Introducing pie charts using the average day

10/3/2015

 
This was one of the first lessons I wrote in the first year of my teaching career, and is still one of my favourite ways to introduce pie charts. There's also loads of scope for adding extra stuff in, such as work on fractions and percentages if appropriate for the group.

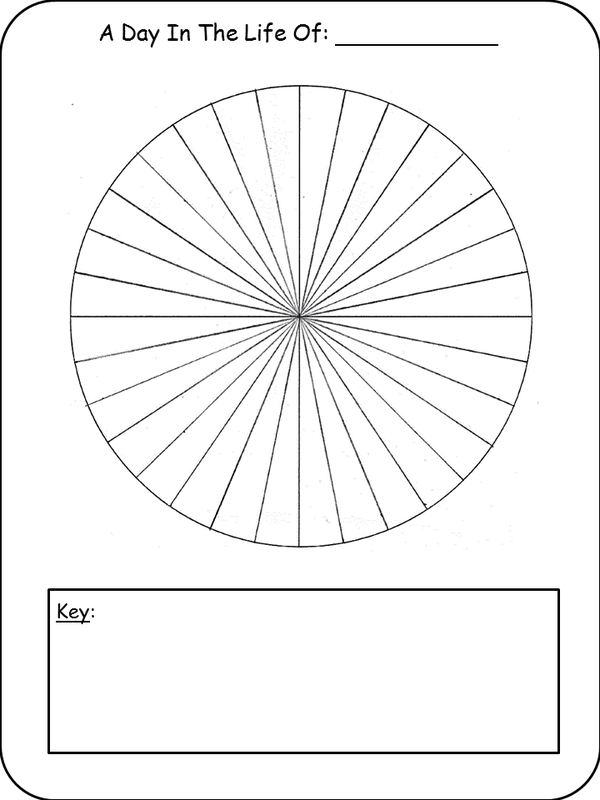
Pupils begin by thinking of the activities that make up their average day, and use a 24-sector pie chart template to colour-code this. They then look at the fractions of their day spent on various activities. Using a life expectancy of 80 years, they then calculate how many years they spend in total over one lifetime on each activity. To finish off, I've recently added this video to the end of the lesson, which looks at representing the average life as a pile of jelly beans.
Picture
  • Download this resource 
  • Find out about password access


    Categories

    All
    #29daysofwriting
    A Level
    Algebra
    Algebra Tiles
    Area
    Assessment
    Bar Model
    Bar Modelling
    Books
    Celebration Of Maths 2015
    Challenge
    Circles
    CPD
    Cuisenaire Rods
    Data
    Decimals
    Displays
    Enrichment
    Equations
    Events
    Feedback
    Formulae
    Four Operations
    Fractions
    Functional Maths
    Gcse 2015
    GCSE Past Papers
    GCSE Revision
    Graphs
    Group Work
    HCF And LCM
    History Of Maths
    Intervention
    Investigation
    Lesson
    Lesson Ideas
    Literacy
    Lotw
    Loving Maths
    Manipulatives
    Marking
    Mastery
    #mathsconf
    #mathsconf2015
    #mathsconf4
    Maths In Pictures
    Multiplication
    Musings
    Negative Numbers
    News
    Numeracy Across Curriculum
    Parenthood
    Percentages
    Pick Of Twitter
    Pie Charts
    Primes
    Probability
    Problem Solving
    Proportion Problems
    Puzzles
    Pythagoras
    Quadratics
    Quadratic Sequences
    Ratio Tables
    Real Life Graphs
    Reflection
    Resources
    Revision
    Rounding
    Schemes Of Work
    Simultaneous Equations
    Square Numbers
    Stationery
    #summerblogchallenge
    #teacher5adaysketch
    Teaching And Learning
    Technology
    Top Ten
    Trignometry
    Trigonometry
    Vectors
    Venn Diagrams
    Websites
    Weebly Tutorials
    Zoombinis


    Archives

    August 2020
    September 2018
    August 2018
    October 2017
    July 2016
    June 2016
    May 2016
    February 2016
    November 2015
    October 2015
    September 2015
    August 2015
    July 2015
    June 2015
    May 2015
    April 2015
    March 2015
    February 2015
    January 2015

    RSS Feed

Powered by Create your own unique website with customizable templates.