It's no secret that I'm a big fan of bar modelling to get pupils to really think about the calculations they are doing. It's a great way to introduce work with percentages too, and solidifies the link between percentage and fraction calculations. One particular advantage is the flexibility it affords - I had one pupil decide that the best way for her to find 15% was to work out 25% and 10%, then subtract one from the other, rather than the more "traditional" method we'd probably all teach of finding 10% and 5%, then adding together.
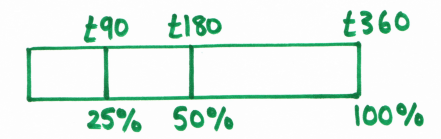
Here's 25% and 50% of £360 on a bar - easily found by halving and halving again.
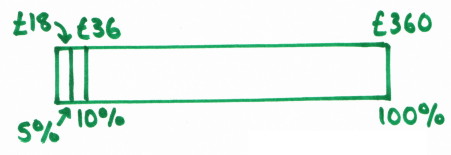
However, although I use bar modelling when introducing new concepts with percentages, once pupils have drawn enough bars to get the ideas, I then push them on to using ratio tables for calculations instead. The bar's great for larger percentages, but once you get down to the useful building blocks like 10% and 5%, the left hand side of the bar starts looking very messy indeed. And you can forget trying to show 1% on a bar with a suitable scale for exercise books. Here's 5% of £360 on a bar:
Now here's a ratio table using £360 (I decided to find 35% in this example):
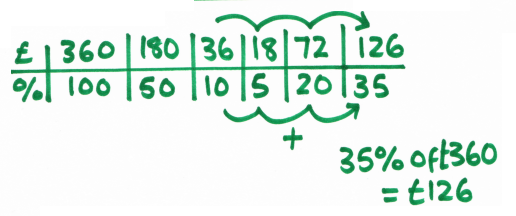
I love using these as the flexibility of the bar is preserved; pupils can still approach problems from different angles and, if they can't see a clear route through a problem, they can at least work out some amounts to see if that helps. You can see that, although I've chosen to find 10%, 20% and 5% then add together, it would equally be fine to work out 30% from 3 x 10%, then add to 5%, or even work out 15% and subtract this from 50%, and some great classroom discussions come out of the different approaches pupils have used.
Here's a bar for £360 increased by 20%:
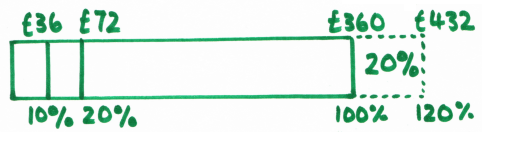
Bars are brilliant for encouraging pupils to think about the idea that increasing an amount by 20% is the same as finding 120% of something, which is useful for further work on percentage multipliers.
And here's a bar for £360 decreased by 20%:
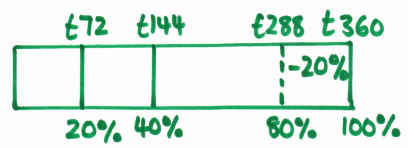
Again, you can see the link between a 20% decrease and finding 80% of that amount.
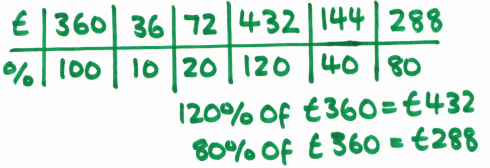
It's worth being very careful about how quickly you move away from bar modelling with percentage change problems; pupils need to be really confident with what 100% means in the context of the problem. However, once they're fine with that, here's a ratio table for £360, with both a 20% increase and 20% decrease shown:
The next logical step is reverse percentages - finding the original price if you know the increased or reduced price. Here's a bar for an item costing £240 with a deduction of 20%:
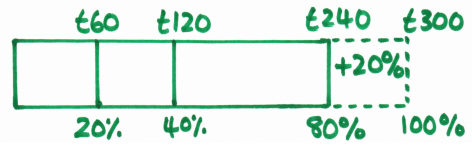
Because there's so much scope for confusion with these, I'd spend a lot more time using bars with pupils until I'm satisfied they can satisfactorily distinguish between these and standard increases or decreases. The bar has a distinct advantage here that it's more difficult to make the mistake of dividing £240 by 10 to get 10%, because it's more intuitive to work down in halves.
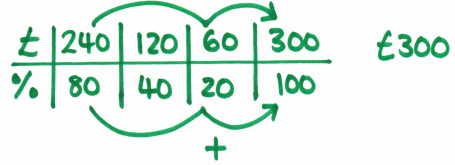
Here's the ratio table:
Here's the ratio table:
Because ratio tables are quick and easy to draw, I encourage them in exam situations for non-calculator problems, particularly for those pupils who get lost in their working out and tend to just scribble their calculations all over the page.
Ratio tables are also fantastic for other problems, such as all the proportion stuff like currency conversion. There's also a direct link to proportion graphs, as you've got your table of values to create the graph straight away.
Ratio tables are also fantastic for other problems, such as all the proportion stuff like currency conversion. There's also a direct link to proportion graphs, as you've got your table of values to create the graph straight away.
 RSS Feed

Whilst these examples all provide effective ways of carrying out the calculation (without a calculator?) as soon as the problem becomes authentic the structural relationship of the reality is always one that relates to a constant of direct proportionality. That is the vertical relationship (in your bar model) is the one that matters. The horizontal number play here is helpful in carrying out the calculation not understanding the actual relationship unless it is used to find the constant of proportionality, i.e. The value of the dependent variable for one unit of the independent variable.
To help with solving real problems - that is those that arise outside of the mathematics classroom - for example in science - it is important that students understand this. How can we direct attention to this if we emphasise the bar model or ratio table so much? Would it be better to axes and graphs from the outset? Should we be emphasising ideas of variable rather than focussing on questions with only one answer? How do we cater for thinking about dependent and independent variables?
Let's widen the discussion beyond one focussed on accuracy of calculation and think about how we might ensure connections within mathematics itself and between mathematics and realities such as science and other areas of application. This would better facilitate deep understanding rather than procedural fluency.
I'd agree with most of what you've said here - I think it's really important that we teach in a way that makes pupils more aware of "the links between topics" (to talk in curriculum speak), or more accurately, that it's all just the same thing! Whenever possible (and relevant) I'd also get pupils to consider all of the points you've raised - so looking at graphical representations, finding the constants of proportionality and developing algebraic links, and also thinking about linear relationships which aren't directly proportional (and why not).
However, I don't think there needs to be an emphasis on one thing or another. It's important for pupils to have an efficient method grounded in understanding to carry out calculations, as otherwise they can't actually DO any maths with the stuff they've developed the understanding of, but it's equally important to be ensuring that pupils do experience relevant, realistic applications and work with these in depth.
With percentages "in real life", there is often one answer that we're interested in - if this item's reduced by 20%, how much will I be paying? If I have x amount in my bank account and I'm being paid 0.5% interest per year, how much will I get? I certainly wouldn't work purely with graphs for percentage calculations!
I also agree that we need to consider the examples we're using more carefully - I think there's more scope in the maths classroom to use ideas pupils will meet in the science curriculum and elsewhere, rather than make up irrelevant problems with meaningless variables.
I would say you're both (Geoff and Miss Norledge) right - it depends on the student and what they need this maths for.
Anyway, I was surprised to see these ratio tables with the £ and % rows because I thought I'd invented them during a lesson yesterday. Great minds think alike! They still didn't work for this particular student so I shall attempt manipulatives next time.
Anyway, thanks for a great page and lots of useful ideas.