Miss Norledge's Storeroom
  • Home
  • Resources by Topic
    • Number and Proportion
    • Algebra
    • Shape
  • Blog
    • Summer Blog Challenge
    • Staffrm 29 Days of Writing (2016)
    • Maths with Zoombinis
  • My resources
    • Downloads >
      • Mix Match
      • Rally Coach
      • Pass the Problem
    • Request a password
  • Links
    • Teaching blogs and resources
    • Web tools and apps
    • Exams and assessment
  • Privacy Policy


Exponential growth and the chessboard problem

25/7/2015

 
I decided that a resource post was long overdue for the #summerblogchallenge, so I thought I'd post one of my favourite lessons. I put this together after discovering the fantastic Gapminder website a couple of years ago, and it's designed to provide a nice real-life link for exponential growth.
This lesson looks at two different scenarios. It starts with the famous “Chessboard Problem” involving grains of rice on a chessboard. Pupils calculate how many grains of rice on the first few squares. This links to ideas about population growth; pupils plot a graph of population growth over the last 200 years and use their graph to predict what will happen in the year 2050. Finally, discuss limitations of the exponential model and real-life interpretations of why the model may not be accurate (e.g. lack of natural resources). I have used this successfully with a middle-ability group in Year 9, so prior knowledge of exponential graphs is not necessary.
Pupils start off by estimating the Earth’s population in 2050 and writing their answers on a Post-It - there will be some very interesting answers at this point!

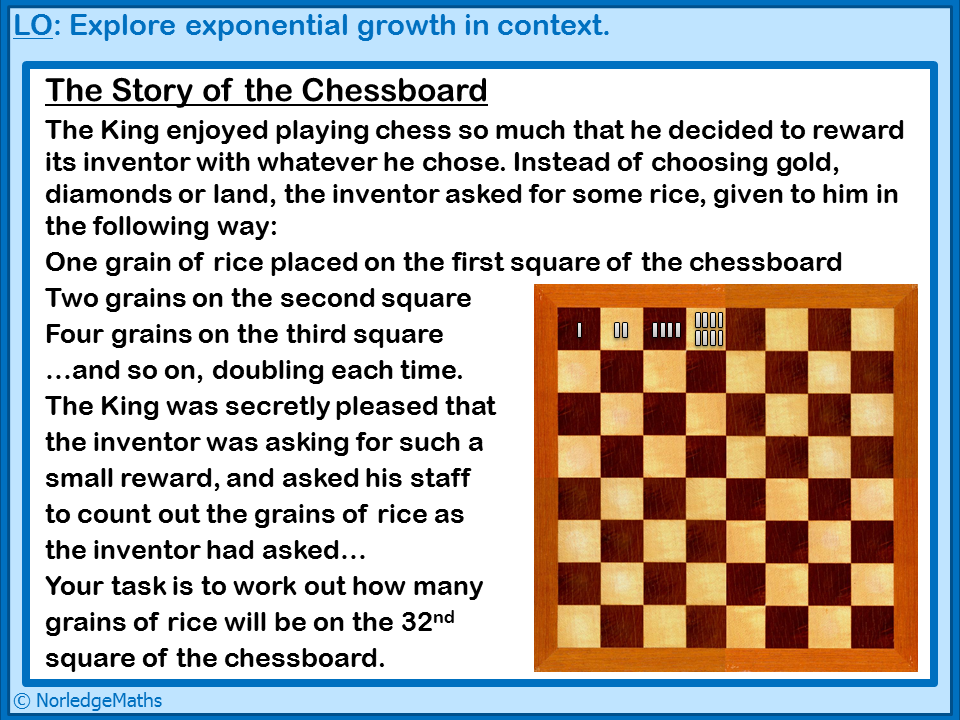
We then go through the story of the Chessboard Problem, either as a discussion or by asking pupils to read through it themselves and then summarise as a class - a good literacy opportunity.

Pupils work out how many grains of rice will be on the 32nd square of the chessboard, either independently or in groups. Encourage pupils to work systematically and show how they have got their answer.

Pupils then plot this information on a graph- sometimes they need support in terms of a sensible scale for their axes. This results in the graph y = 2 to the power x. It's not necessary for pupils to use this algebraic representation during the lesson, but might be worth pointing out.
Picture
  • Download this resource
  • Find out about password access
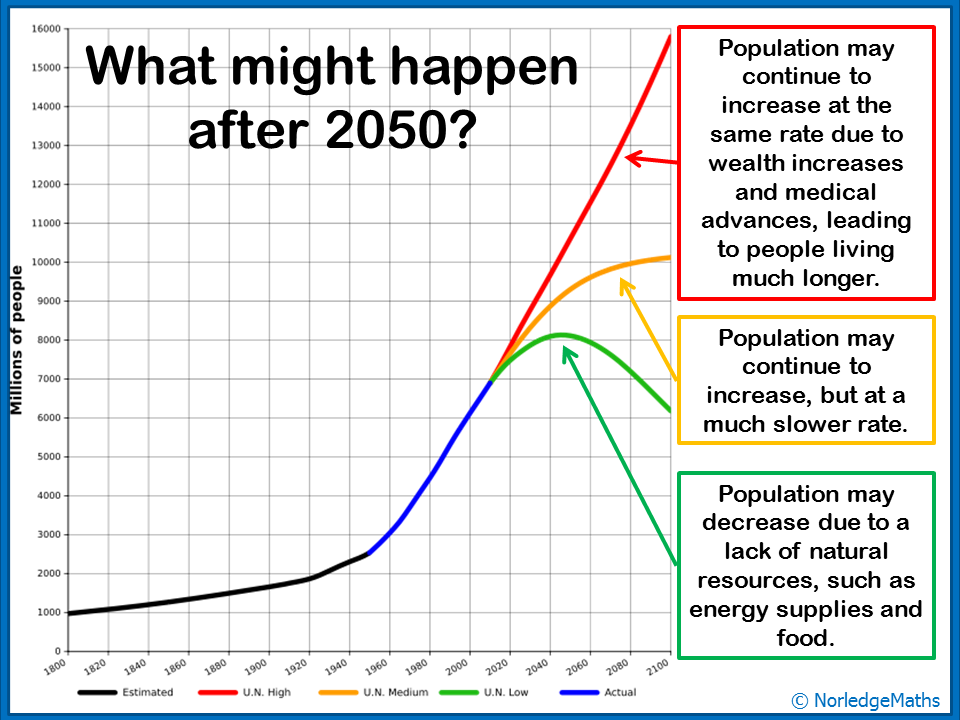
After revealing the answer and providing a bit of context (the total amount of rice on all 64 squares would weigh over 100,000kg and be larger than Mount Everest), pupils then have a go at plotting a similar graph using world population data and comparing their initial estimate to the graph's predicition. Many of them will have instinctively used a linear model in their initial prediction.

It's nice to have a discussion about why they think population is growing at such a rapid rate (better medicines, quality of life, scientific knowledge). Is it realistic for the population to continue growing at such a rate and consider what factors may limit population growth (lack of natural resources, physical space on the planet)?

The video "What Stops Population Growth" from Gapminder is great to finish off the lesson - it's ten minutes long, but most of the pertinent points are within the first few minutes.
Picture

Picture

Previous Posts

(7/51)Looking back, looking forward

(6/51) 
Quantity, not quality?

(5/51) 
How does Bob Marley like his maths...?

What is the #summerblogchallenge?

Comments are closed.

    Categories

    All
    #29daysofwriting
    A Level
    Algebra
    Algebra Tiles
    Area
    Assessment
    Bar Model
    Bar Modelling
    Books
    Celebration Of Maths 2015
    Challenge
    Circles
    CPD
    Cuisenaire Rods
    Data
    Decimals
    Displays
    Enrichment
    Equations
    Events
    Feedback
    Formulae
    Four Operations
    Fractions
    Functional Maths
    Gcse 2015
    GCSE Past Papers
    GCSE Revision
    Graphs
    Group Work
    HCF And LCM
    History Of Maths
    Intervention
    Investigation
    Lesson
    Lesson Ideas
    Literacy
    Lotw
    Loving Maths
    Manipulatives
    Marking
    Mastery
    #mathsconf
    #mathsconf2015
    #mathsconf4
    Maths In Pictures
    Multiplication
    Musings
    Negative Numbers
    News
    Numeracy Across Curriculum
    Parenthood
    Percentages
    Pick Of Twitter
    Pie Charts
    Primes
    Probability
    Problem Solving
    Proportion Problems
    Puzzles
    Pythagoras
    Quadratics
    Quadratic Sequences
    Ratio Tables
    Real Life Graphs
    Reflection
    Resources
    Revision
    Rounding
    Schemes Of Work
    Simultaneous Equations
    Square Numbers
    Stationery
    #summerblogchallenge
    #teacher5adaysketch
    Teaching And Learning
    Technology
    Top Ten
    Trignometry
    Trigonometry
    Vectors
    Venn Diagrams
    Websites
    Weebly Tutorials
    Zoombinis


    Archives

    August 2020
    September 2018
    August 2018
    October 2017
    July 2016
    June 2016
    May 2016
    February 2016
    November 2015
    October 2015
    September 2015
    August 2015
    July 2015
    June 2015
    May 2015
    April 2015
    March 2015
    February 2015
    January 2015

    RSS Feed

Powered by Create your own unique website with customizable templates.